In literature, dispersion has often been modeled as convolution of the temporal activity concentration with an exponential kernel
whereby the parameter τ is called Dispersion (eg. Meyer et al. [1]).
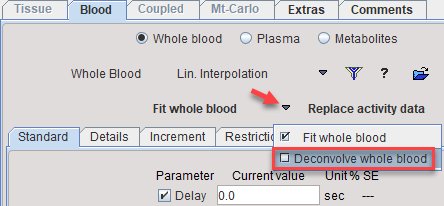
PKIN offers a facility to perform a numerical deconvolution by such a kernel. The feature can be used by loading the data with Load Whole Blood Activity and selecting Deconvolve whole blood as illustrated below.
A dialog window appears as illustrated below. Note that the blood model curve will be deconvolved, not the blood measurement. The reason is that the deconvolution process amplifies noise in the data, so it is recommended first fitting a smooth function to the data.
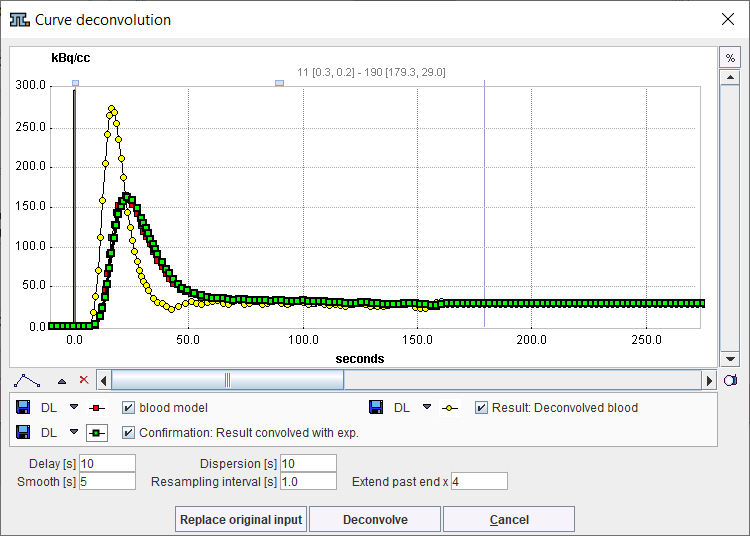
Dispersion is the main parameter, which has to be known and entered. The deconvolved curve can be shifted left by a Delay. The other parameters are related to the deconvolution process which performs the following operations when Deconvolve is activated:
1.Regular resampling of the blood model function with the specified Resampling interval. The signal is extended past the measurement using the model function to reduce the cutoff effect (if the function is decreasing). Extend past end x is a factor which is multiplied with the acquisition duration.
2.Calculation of the dispersion kernel for the same sampling times.
3.Forward Fourier transform of the model and the exponential after some tapering and applying a frequency cutoff corresponding to the Smooth parameter and a tapering Hanning filter.
4.Divide the transformed model by the transformed exponential.
5.Inverse Fourier transform of the result, and resampling the real part of the result.
6.Convolve the Result: Deconvolved blood with the exponential kernel to get Confirmation: Result convolved with exp.
Ideally, Result and Confirmation would be identical. In practice, this will never be the case due to the numerical procedures. The result depends on the curve shape, the noise, and the Smooth and Dispersion parameters. The user will have to find parameter combination which provides a reasonable result. If this is possible, the result can be used for further processing with Replace original input.
Reference
1.Meyer E: Simultaneous correction for tracer arrival delay and dispersion in CBF measurements by the H215O autoradiographic method and dynamic PET. J Nucl Med 1989, 30(6):1069-1078. PDF