The Kinetic menu contains an entry Aggregate Parameters. Its purpose is to concentrate the parameter values which have been saved in KM Parameters Files (*.kinPar) for statistical analysis. The general concept and the details of data aggregation are explained in the PMOD Base Functionality Guide.
Component Selection
Aggregate Parameters opens a dialog window with two tabs as illustrated below.The Select components pane allows defining the .kinPar files from which the parameters are extracted.
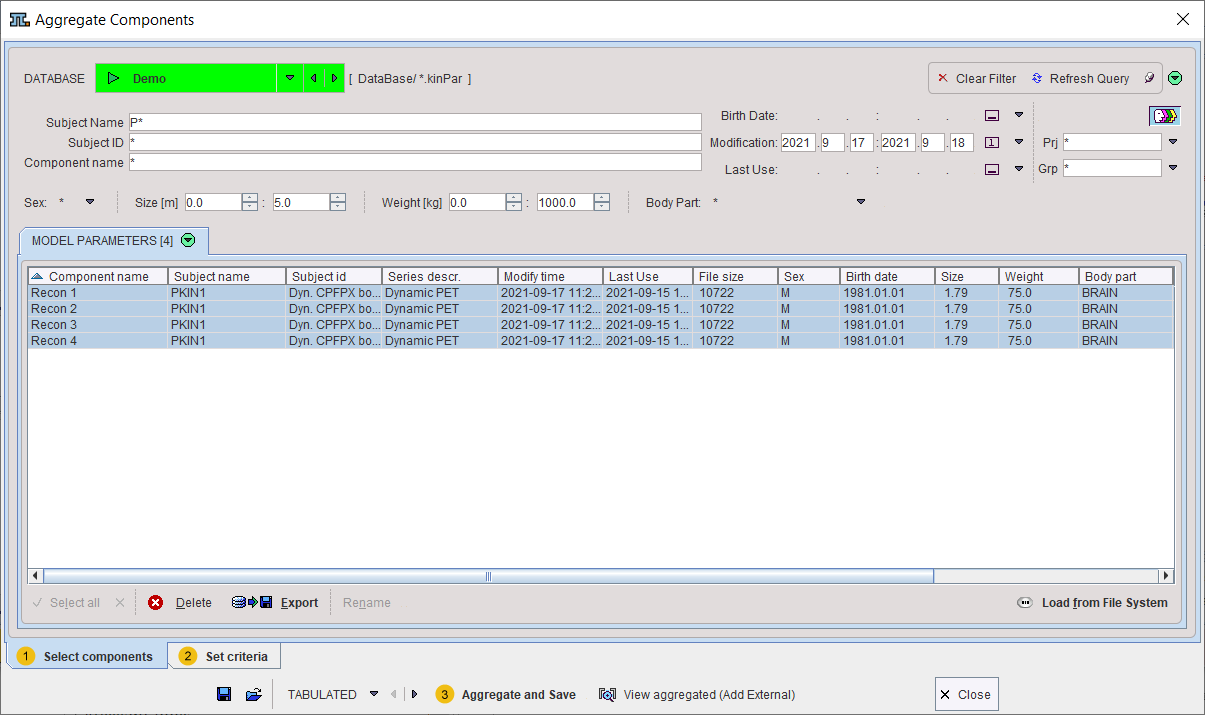
The files may be available in a database as in the example above, or in a disk directory. In the latter case use Load from File System to define the directory were the files reside. All appropriate .kinPar data sets are listed. Select all data sets to be used for the aggregation and then switch to the Set Criteria pane.
Content Selection
The upper part Reorder Selected Components lists the data sets which have been selected for aggregation. They can be reordered if needed.
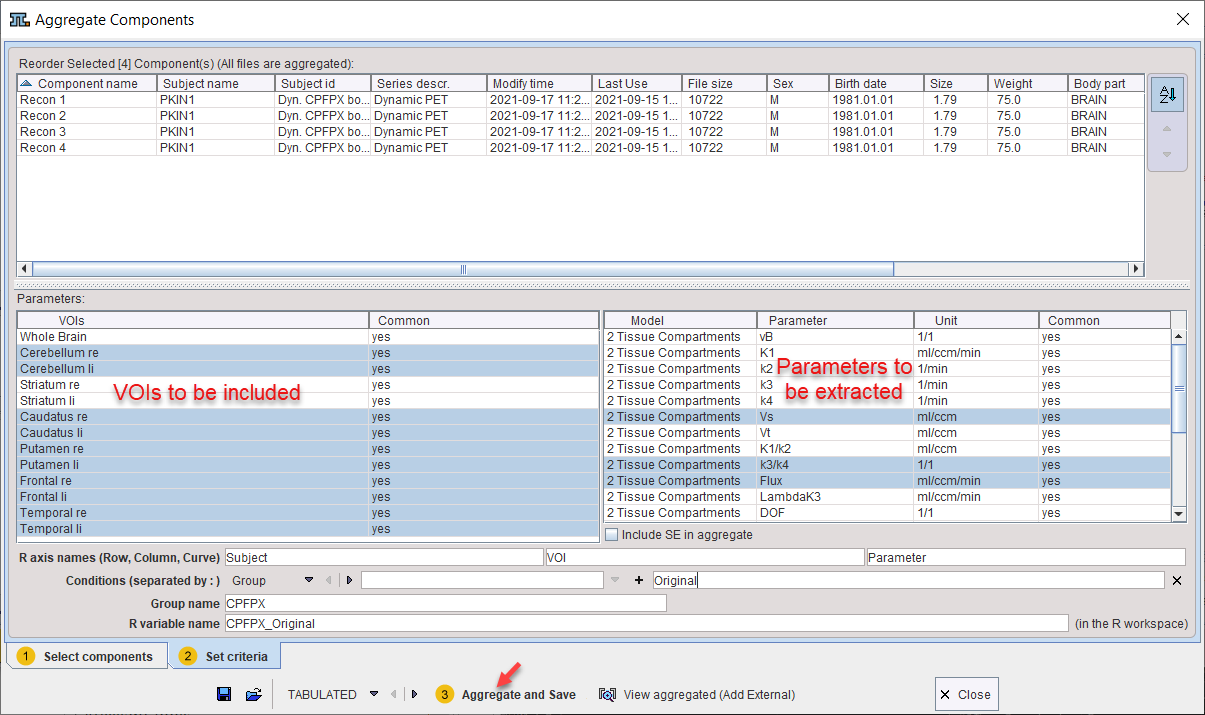
The Parameters section shows the information contained in the .kinPar files. The left part lists the available VOIs, the right part the kinetic model parameters. A yes label in the Common columns indicates that all of the kinPar files include the particular element. Otherwise, a no label is shown. Note that entries which are not available in a data set will result in a NaN value in the aggregate.
Data Aggregation
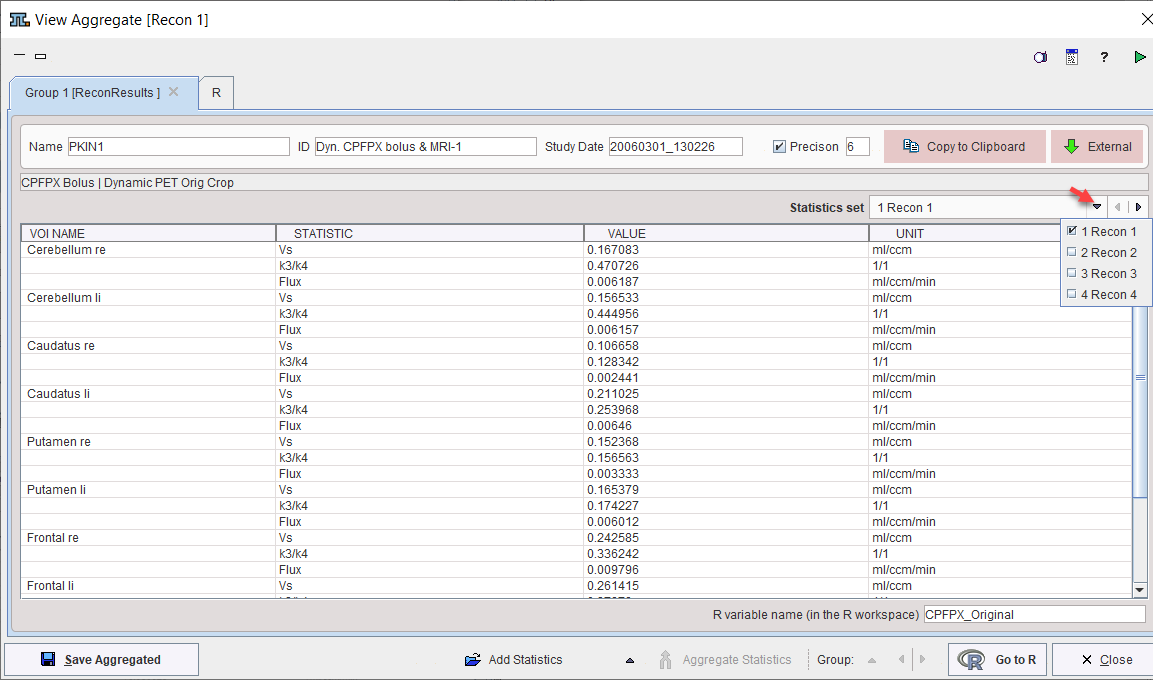
Select the VOIs and parameters to be included so that they are highlighted, and activate Aggregate and Save. Specify the name of a database table, or a file name if the database is not used. When opening the saved aggregate with the View aggregated button, the statistics window appears with a selection for the Statistics set.
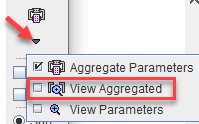
Aggregated parameters can also be opened again using the View Aggregated button from the taskbar to the right.
Application Cases
A typical example is the aggregation of the results of a test study in a test aggregate, and the results of the same population in a retest study in a retest aggregate. The two aggregates can then directly be used for a test-retest analysis using the PMOD R console.
Another example is the comparison of two analysis methods. In this case the results of the different methods would be aggregated in corresponding aggregates, which can then be compared with a Bland-Altman analysis.