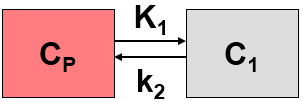
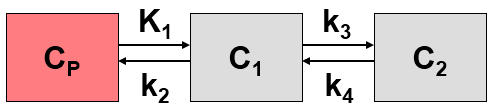
The Logan plot has been developed by Logan et al. [1] for ligands that bind reversibly to receptors and enzymes and is used for estimating the total distribution volume VT. Its results can be interpreted with respect to the 1- and 2-tissue compartment models.
Operational Model Curve
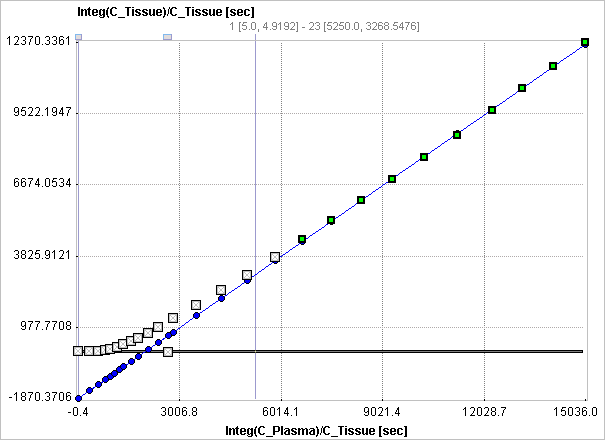
The Logan plot belongs to a group of Graphical Analysis techniques, whereby the measured tissue TAC CT(T) undergoes a mathematical transformation and is plotted against some sort of "normalized time". The Logan plot is given by the expression

with the input curve Cp(t). This means that the tissue activity integrated from the time of injection is divided by the instantaneous tissue activity, and plotted at a "normalized time" (integral of the input curve from the injection time divided by the instantaneous tissue activity). For systems with reversible compartments this plot will result in a straight line after an equilibration time t*.
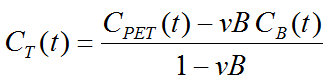
In the derivation of the Logan plot the PET signal is described as a sum of tissue activity plus a fractional plasma signal
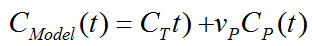
unlike the operational equation of the compartment model. Under these premises the slope represents the total distribution volume VT plus the plasma space vP in the VOI, which is usually neglected. Alternatively an explicit blood volume correction is available via the vB input parameter. In the case of vB=0 (default setting), no correction is performed. For vB>0, the tissue TAC is corrected by the scaled whole blood activity before the actual analysis.
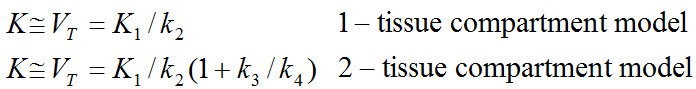
The relation of the slope to the parameters of the compartment models is given by
It has been found that the Logan plot is susceptible to noise in the data. Noise causes the true VT to be underestimated, to a degree which not only depends on the noise level, but also on the local kinetics. The underestimation problem is particularly relevant in parametric mapping, where the pixelwise TACs suffer from a high noise level.
The reason for the underestimation effect is the fact that noise is not only present in the y-values (dependent variable) as the linear regression assumes, but also in the x-values (independent variable). To arrive at more accurate results it was therefore proposed to measure the residuals perpendicular to the regression line, rather than vertical to the x-axis [2].
Parameter Fitting
The Logan Plot model calculates and displays the measurements transformed as described by the formula above. It allows to fit a regression line within a range defined by the start time of the linear section t*. The results are the distribution volume (slope) and the intercept. There is also an error criterion Max Err to fit t*. For instance, if Max Err is set to 10% and the fit box of t* is checked, the model searches the earliest sample so that the deviation between the regression and all measurements is less than 10%. Samples earlier than the t* time are disregarded for regression and thus painted in gray. Note that t* must be specified in real acquisition time, although the x-axis units are in "normalized time". The corresponding normalized time which can be looked up in the plot is shown as a non-fitable result parameter Start.
The regression line is calculated using the traditional and the perpendicular distances, resulting in the total distribution volumes Vt and Vt_perpend, respectively. It has been found that Vt has a tendency to underestimate the distribution volume at increasing noise levels. Vt_perpend shows less bias due to noise, but suffers from a somewhat increased variability.
References
1.Logan J, Fowler JS, Volkow ND, Wolf AP, Dewey SL, Schlyer DJ, MacGregor RR, Hitzemann R, Bendriem B, Gatley SJ et al: Graphical analysis of reversible radioligand binding from time-activity measurements applied to [N-11C-methyl]-(-)-cocaine PET studies in human subjects. J Cereb Blood Flow Metab 1990, 10(5):740-747. DOI
2.Varga J, Szabo Z: Modified regression model for the Logan plot. J Cereb Blood Flow Metab 2002, 22(2):240-244. DOI