The Spectral Analysis SAIF model allows performing a Spectral Analysis (SA) with an explicit trapping compartment [1].
Operational Model Curve of Spectral Analysis
The operational equation for this type of SA is given by
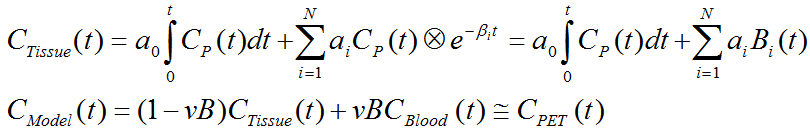
that is, tissue uptake is modeled as a sum of N possible tissue responses plus a flux a0 into the irreversible compartment. Like for the compartment models a fixed blood volume fraction vB is supported.
Due to the constraint of first order tracer kinetics, the coefficients ai and the decay constants bi must be non-negative. In practice, a discrete set of the decay constants βi is selected which covers the physiologically reasonable range, typically logarithmically spaced in the range [10-5,1]sec-1. The corresponding tissue responses
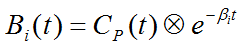
are the Basis Functions of spectral analysis. When fitting the operational equation above to a tissue TAC, the only unknowns are the coefficients ai, because only a pre-defined set of discrete βi values is considered. Therefore, the problem is that of a non-negative linear least squares estimation (NNLS) with the constraint of non-negative coefficients.
An advantage of SA is the fact that no particular compartment structure is imposed. Rather, its result can be used to estimate how many kinetic tissue compartments can be resolved by PET. To this end, the results are plotted as a spectrum with the selected decay constants βi along the x-axis (as the "frequencies") and the estimated coefficients ai along the y-axis (as the "amplitudes"). Because of the large range, log(βi) is used in spectrum plotting rather than βi. The number of peaks in this spectrum corresponds to the number of distinct compartments. A peak appearing to the far left (low frequency, slow component) indicates irreversible trapping. A peak to the far right (high frequency, fast component) corresponds to kinetics indistinguishable from the input curve, thus to vascular contributions. Intermediate peaks represent compartments which exchange reversibly with plasma or with other tissue compartments.
The Spectral Analysis with Iterative Filter (SAIF) approach uses a bandpass filter for selecting the real equilibrating compartments. The passband is defined by a range [βL , βH]. It is assumed that all βi < βL are shifted noise components, and all βi > βH shifted blood components. In an iterative process the following two steps are repeated
1.Subtract the noise and blood components (βi outside [βL , βH]) from the signal, and estimate a0 and vB.
2.Subtract the trapping and blood components (a0 and vB) from the signal and estimate the equilibrating components.
The iteration is repeated until the residuals from step 1 and 2 are very similar.
Parameter Fitting
In the Spectral SAIF model #Exponentials determines the number of discrete βi decay constants which are logarithmically spaced in the range between Beta-min and the Beta-max. There is no well-defined minimum value as in the case of decay-corrected TACs where it is equal to the decay constant of the isotope. The passband of equilibrating compartments is defined by Beta-cutoff low (βL) and Beta-cutoff high (βH). vB is the fractional volume of whole-blood in the signal, which is subtracted before the SA. Flux is the influx into the irreversible compartment and the main result of the model. vBest is the remaining blood component after subtracting the whole-blood contribution.
Estimates of the tissue uptake constant K1 and the total distribution volume Vt of all reversible compartments can be calculated based on the peaks found in the spectrum. nPeak is the number of peaks in the spectrum, whereby immediately neighboring spikes are grouped into a single peak.
The SA results can be visualized in 3 different ways with a corresponding radio button setting:
1.Display TAC shows the TAC together with the model curve calculated from the detected peaks.
2.Display Spectrum shows the peaks in the spectrum.
3.Display unit IRF shows the Impulse Response Function which depends on the Exclude HF setting.
Reference
1.Veronese M, Bertoldo A, Bishu S, Unterman A, Tomasi G, Smith CB, Schmidt KC. A spectral analysis approach for determination of regional rates of cerebral protein synthesis with the L-[1-(11)C]leucine PET method. J Cereb Blood Flow Metab. 2010;30(8):1460-76. DOI