To calculate the calibration factor start the (PSAMPLE) Twilite Correction module from the PMOD ToolBox.
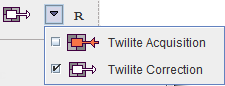
It has two pages: the Correction page for correcting a measured input function, and the Calibration Factor page for calculating the calibration factor from the calibration procedure as described above. Please proceed as follows:
1.Select the Calibration Factor page.
2.Load the raw data from the twilite calibration experiment using the Load Calibration TAC button. The coincidence rate during the measurement is displayed in the curve area as Calibration Measurement [counts/sec] with red squares. It should show a level background at the beginning, and a step when the template was inserted into the head.
3.Enable the Decay Correction and Branching Ratio correction (at present only available for selected isotopes) and select the appropriate isotope from the selection list.
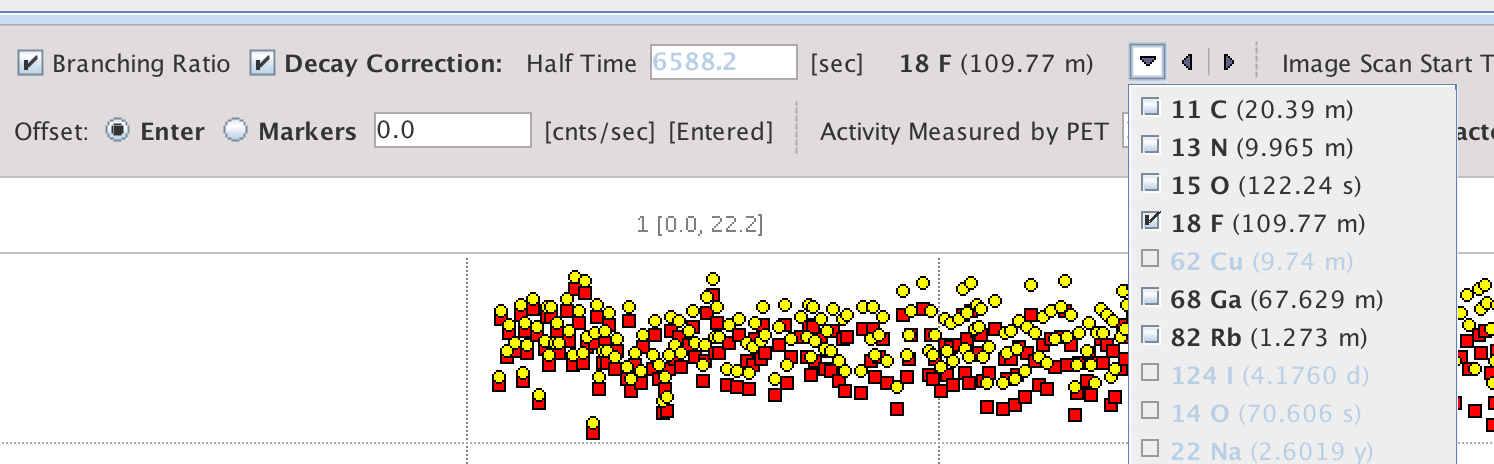
4.The decay correction is applied relative to the start of the twilite acquisition and the corrected data shown as Decay-corrected [counds/sec] with yellow dots. Branching Ratio correction is a division of the counts (minus background, once defined) by the branching ratio.
5.There are two methods provided to subtract the background activity Offset: Enter and Markers. The Markers operation mode is only suitable for step function calibration data. It activates the display of two shaded areas, one in dark green to the left, and another in light green to the right. The dark green area should be placed over the background area in order to calculate the average background rate (calculated from Calibration Measurement [counts/sec]; red squares), whereas the light green area defines the portion of signal from the activity to be averaged (calculated from Decay-corrected [counts/sec]; yellow dots; after subtraction of the averaged background counts). Therefore, the placement should be as illustrated below:
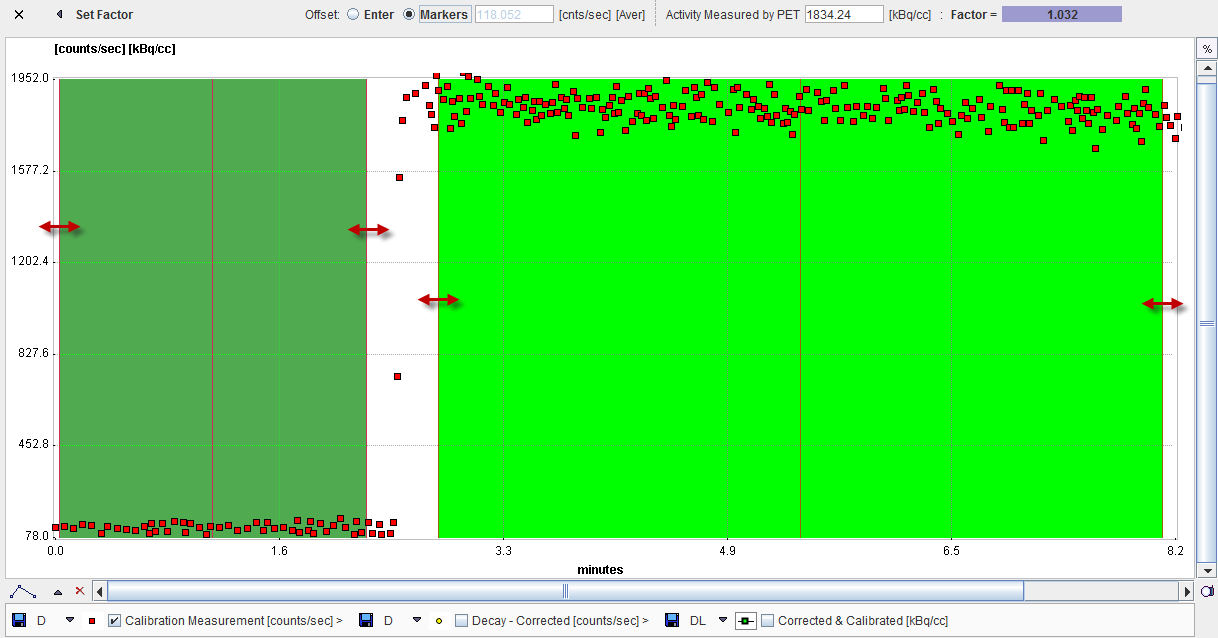
The area can be placed by dragging the edges, or the center line.
The Offset: Enter mode requires a different calibration protocol. It assumes that the entire acquisition was performed with a filled catheter inserted in the detector head, such that the signal average is calculated from the whole data range, and the background is entered manually. The background can be determined by monitoring the twilite touch screen display, or through a separate acquisition without activity and averaging of the counts.
6.Next, correct the PET Scan Start Time. Initially it is set to the time when the twilite was started. Enter the proper PET start time from the phantom PET acquisition. The differences between the two starting times will be used to decay correct the twilite data to the time of the PET scan start.
![]()
7.Finally the Activity Measured by PET is required. Enter the average activity determined with the phantom image (e.g. in a volume-of interest, avoiding edges where spill-out may artificially reduce the average), kBq/cc.
8.At this time, the calibration Factor is determined and can be seen in the user interface. The Corrected & Calibrated [kBq/cc] curve in green squares illustrates the effect of the calibration factor on coincidence counts from the twilite.
9.The calibration factor can be transferred to the Correction tab using the Set Factor button, and the calibration configuration saved using the Save Calibration Defaults button.