The following two approaches can be employed to investigate whether a selected model is too complex for the data. The implementation in PKIN is based on the handout Kinetic model evaluation with sensitivity functions and correlation matrices by Dr. M.M. Graham, University of Washington at the Technical Exhibition of the Society of Nuclear Medicine Annual Meeting 1995 (JNM vol 36, no 5, P1208). As to our knowledge, there is no follow-up paper about this subject.
Sensitivity
If a parameter value is changed there should be some visual change in the model output. Some parameters will cause more change than other. The model is more sensitive to a parameter that causes more change in the output.
The sensitivity functions Sens(ki) for the different parameters ki are obtained by calculating the model function twice: with the initial parameter set, and after changing the parameter ki by 1%. Then, the expression
Sens(ki,t)= 100*[Model(ki*(1.01), t)-Model(ki, t)]/Model(ki, t)
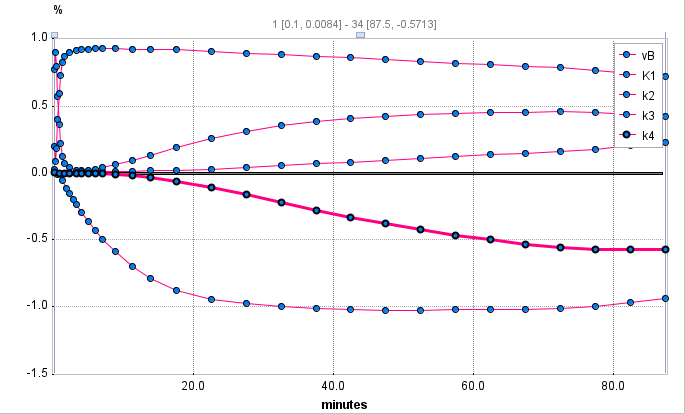
is calculated over time. When the 1% change of ki has changed the output by 1% at a certain time the sensitivity function is equal to 1. In PKIN, the sensitivity functions are calculated for all model parameters, whenever the Sensitivity pane is selected. The example below shows the sensitivity functions of a FDG data set.

Examination of the sensitivity curves shows at what time a parameter has significant sensitivity and how sensitive a parameter is compared to another. If the sensitivity curves of two parameters have the same shape it is unlikely that one can tell which parameter has changed (ie. they are not identifiable).
In the example above the model is quite insensitive to vB. Furthermore, the k3 and k4 curves have a quite similar (but opposite) shape throughout the acquisition duration, indicating that there is a substantial correlation between these parameters.
Identifiability
The model output must change in a unique way when changing a model parameter. If the change in the model output is the same when changing either of two parameters they can not be independently identified. In this situation the model must be simplified further, or one of the parameters can be fixed at a physiologic value. The latter approach is better since simplification usually means essentially setting one of the parameters equal to zero or infinity.
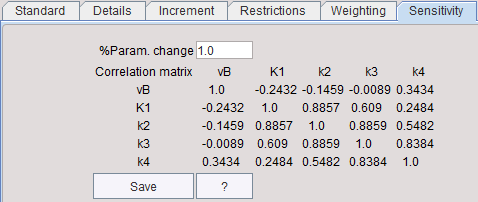
A more quantitative way to look at parameter identifiability is to generate a correlation matrix. It shows how the various parameters tend to correlate with each other. A low value, close to 0, means they do not correlate and that they are identifiable from one another. A high value, close to 1, means they are highly correlated and not independently identifiable.
The correlation matrix is calculated by:
1.generating the sensitivity matrix SM given from the sensitivity functions by SM(i,j)=Integral(Sens(ki,t)*Sens(kj,t));
2.inverting the sensitivity matrix SM(i,j), resulting in the covariance matrix;
3.normalizing the covariance matrix by dividing each element by the square root of the product of the corresponding diagonal elements; result is the correlation matrix .
The correlation matrix is shown in the Sensitivity pane. Using the Save button the correlation matrix and the sensitivity functions can be save into a text file.

Note: Sensitivity functions are currently only supported for compartment models.