The purpose of performing Monte Carlo simulations in kinetic modeling is to get information about the standard error of the parameter values found in a fit. There are two different kinds of sources which contribute to the uncertainty of the parameters:
1.All the input data are measured and hence prone to measurement errors.
2.The model may contain more parameters than supported by the data, so that the effect of one parameter may be counter-balanced by another parameter.
The paradigm used for performing Monte Carlo simulations is described by Flannery et al. [11]. The basic idea is to simulate a series of measurements and statistically analyze the results when modeling these synthetic "measurements".
In PKIN Monte Carlo simulations can be performed for models applied to a single tissue and models coupled across several tissues by selecting the respective option button on the Mt-Carlo panel.
Noise Specification
Three types of "noise" can be defined. For each "noise" the distribution type as well as the variance has to be configured. After selecting the distribution a dialog window appears for defining the variance as described in the Residual weighting for model fitting.
1.Add noise to tissue TAC. Note that here only the noise distribution needs to be selected. The noise variance is adopted from the Weighting tab on the Tissue pane. If Add noise to measurement is not selected, noise is added to the tissue model curve, otherwise to the measured TAC. The latter e.g. allows studying the effects when fitting a simplified model to the data.
2.Add noise to blood allows simulating noisy input curves. This option is only supported for blood models of type Lin. Interpolation.
3.Variation of initial parameters is disturbing the starting conditions from the ideal solution. For instance 20% noise can be added to the ideal parameter values.

Noise Distributions
Three different distributions are available for noise generation, Gaussian, Poisson, and Uniform. They are applied for each individual measurement with the prescribed variance.
For the tissue noise simulations there is also the Bootstrap method available. With the Bootstrap approach, the weighted residuals wri of the initial fit are used [73]. For simulating a noisy curve, these residuals are randomly selected and added to the model curve. Specifically, the noise for a frame j is constructed from a randomly selected wri of frame i by dividing it by the weight of frame j. As a consequence, it will have the same effect in the fit as it originally had in frame i.
Monte Carlo Process
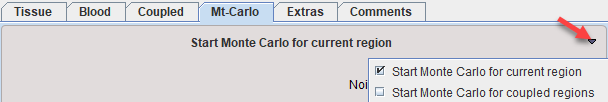
When the Start Monte Carlo for current region button is selected the following processing starts:
1.An initial fit is performed. From then on it is assumed that the result parameters represent the "true" parameters.
2.The number of Simulations times a noisy data set is prepared according to the definitions and then fitted. Noise is added to the model (or tissue) curve, and optionally the input curve. The "true" parameters, optionally disturbed by some noise, are used as starting values, and the fit to the noisy data performed. If Record results in fitting history is checked, the result is saved to the fitting history together with the noisy TAC. Otherwise, just the resulting parameter values are recorded.
Note: For non-compartment models the noise is added to the measured values, as the target may represent transformed data such as a graphical plot. For reference tissue models noise is only added to the target TAC.
3.After all runs have completed, the distribution of the result parameters is analyzed resulting in a mean and a standard deviation value for each fitted parameter. These values are shown on the Standard tab of the Tissue page, and the model curve calculated with the mean parameters is shown. Note that often it does not follow the measurement as closely as with fitted parameters. The Monte Carlo results should now be saved, because as soon as a parameter is changed or a new fit is initiated, the results get overwritten.

Note: Fitting uses all settings defined on the Extras panel.
It is possible to visualize a summary of the fit results during the Monte Carlo runs by switching back from the Tissue to the Mt-Carlo pane. In the curve display, a new curve Monte Carlo Data Min/Max appears with vertical bars. The end points of these bars mark the minimal and the maximal value that any of the resulting model curves reached at a particular time point.

Fitting History
The value of using the fitting history is illustrated below after a Monte Carlo simulation with enabled Record results in fitting history. Each entry from the simulation has a common Revision number. The Monte Carlo Initial Fit line contains the result of the first fit to the original data. If Add noise to measurement is not selected, the model curve shown is the curve to which the generated noise is added. The following entries Monte Carlo Simulation are the individual fits to the generated noisy TACs. The final line Monte Carlo Result represents distribution of all individual fits: the parameters are calculated as the average across the individual fits, and the standard error as their standard deviation.
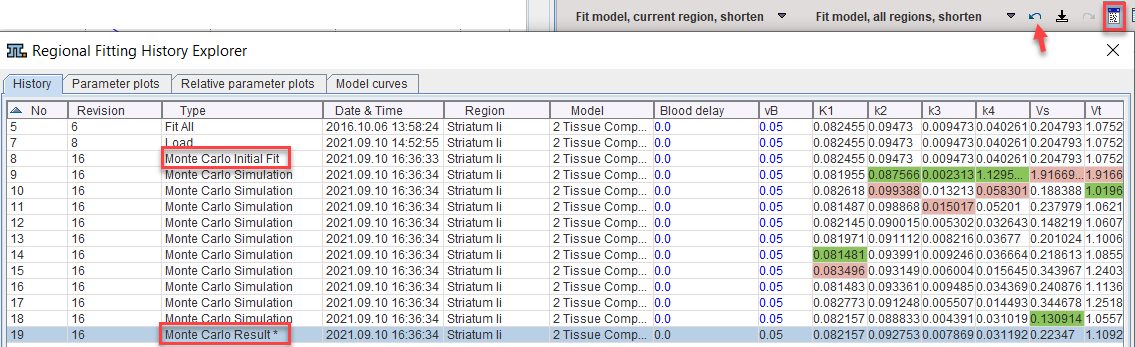
Double-click into the history to show the noisy TAC and the fit result of a simulation. Use the arrows

to conveniently step through the simulations.
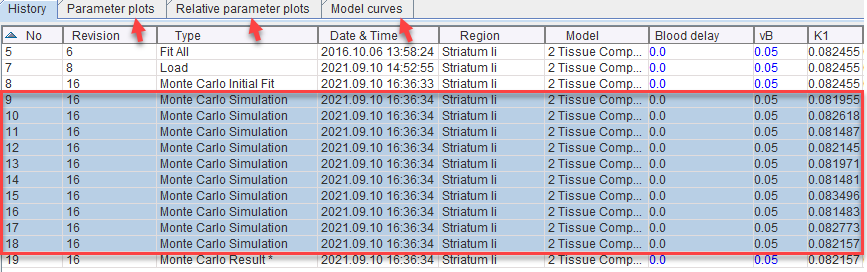
Note that the results of the simulations can also be visually presented by selecting all simulations in the History panel and selecting the other panels. The Parameter plots and Relative parameter plots show the individual parameters across the simulations as absolute and relative values, respectively. Model curves shows all noisy TACs with the respective fitted model curves.
The individual fit results can also be saved for dedicated statistics. To this end select an entry with the Revision of the Monte Carlo simulation, then use Save Selected Revision as illustrated below.
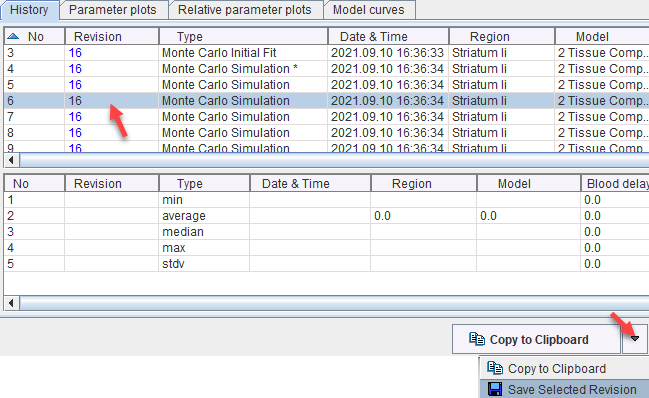
Note: When saving a .km file, the history is included. Therefore the file created can become large when including extended Monte Carlo simulations.
Several Tissues Coupled
The same principle as for the single tissue Monte Carlo simulation applies to a coupled Monte Carlo simulation. It can be started by Start Monte Carlo for coupled regions and uses the configuration prepared on the coupled panel. Model noise uses the weighting individually defined for each coupled region. The fitting history of all coupled regions uses the same Revision number, so that all results can be exported at once.