This is an auxiliary model which cannot be used for fitting. It calculates the following curves from the input curve CP(t) and the selected regional tissue TAC CT(t) at the frame mid-times:
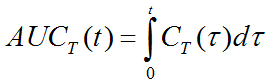
1.The AUC of the tissue TAC as a function of time:
2.The AUC of the input curve as a function of time:
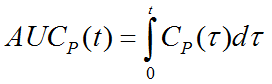
Note that the integration uses the interpolation model selected for the blood curves involved in the calculation of the input curve.
3.The ratio of the two AUCs as a function of time
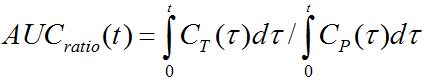
It provides an indication of the tissue accumulation of the tracer [1].
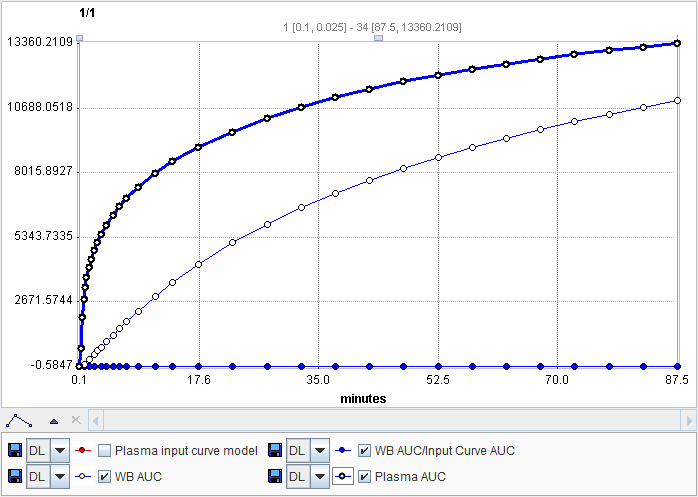
As the ratio curve has a completely different scaling than the curve integrals, it appears along the zero line. It can be shown with appropriate scaling by hiding all other curves. The easiest way to export the values is using the Save all curves or the View values option in the context menu (right click into curve area).
Reference
1.Eyal S, Chung FS, Muzi M, Link JM, Mankoff DA, Kaddoumi A, O'Sullivan F, Hebert MF, Unadkat JD: Simultaneous PET Imaging of P-Glycoprotein Inhibition in Multiple Tissues in the Pregnant Nonhuman Primate. Journal of Nuclear Medicine 2009, 50(5):798-806. DOI