The MLAIR method has been developed by Kim et al. [1] for tracers undergoing irreversible trapping. It is an elternative to the Patlak plot analysis which is dependent on the specification of an equilibration time t* which may vary among tissues, and may suffer from bias when applied to noisy data. It has applied for the analysis of FDG, which can be modeled as a 2-tissue compartment model with k4=0, and 11C-labeled MeNTI [1].
Operational Model Curve
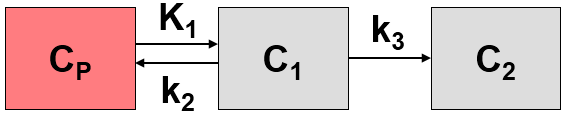
The authors develop two approaches, both of which are included in the Irreversible Ki (MLAIR) model. The 2-tissue compartment model structure with k4=0 is assumed. A blood volume fraction vB is taken into account, but applied to the metabolite-corrected input curve Cp(t) rather than the whole-blood activity.
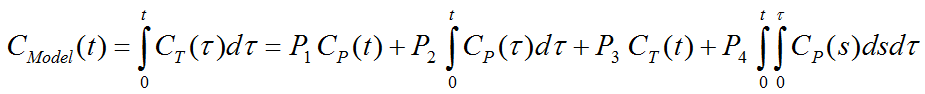
The operational equation of method MLAIR1 for the the measured tissue TAC CT(t) is given by
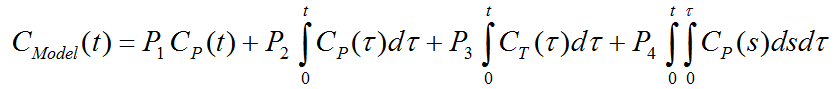
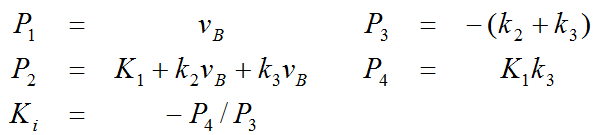
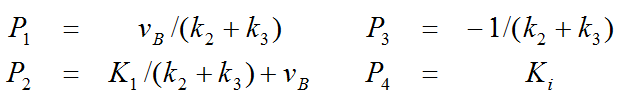
The linear coefficients are related to the model parameters as follows, allowing to calculate the influx Ki from P3 and P4.
In order to avoid the P4/P3 division of MLAIR1 which might intorduce artefacts for noisy data, a second second multilinear operational equation MLAIR2 was developed which estimates Ki as a direct regression parameter. MLAIR2 has the following operational equation for the integrated tissue activity curve:
Parameter Fitting
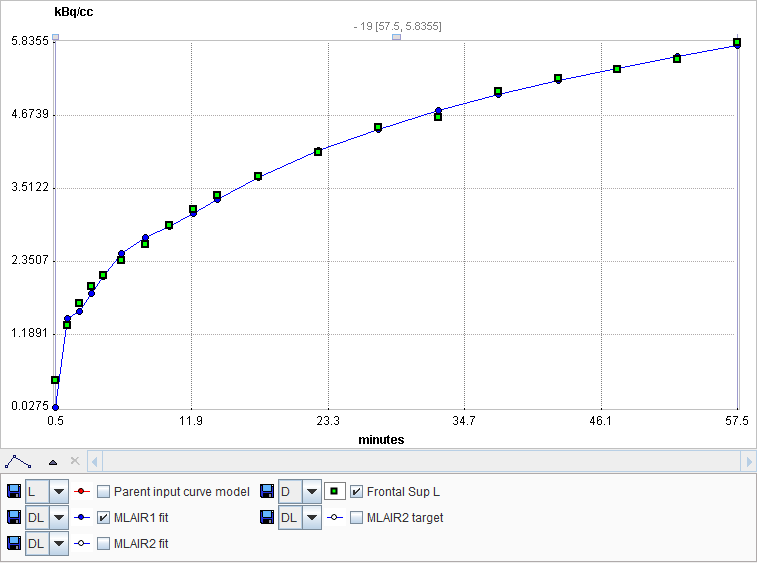
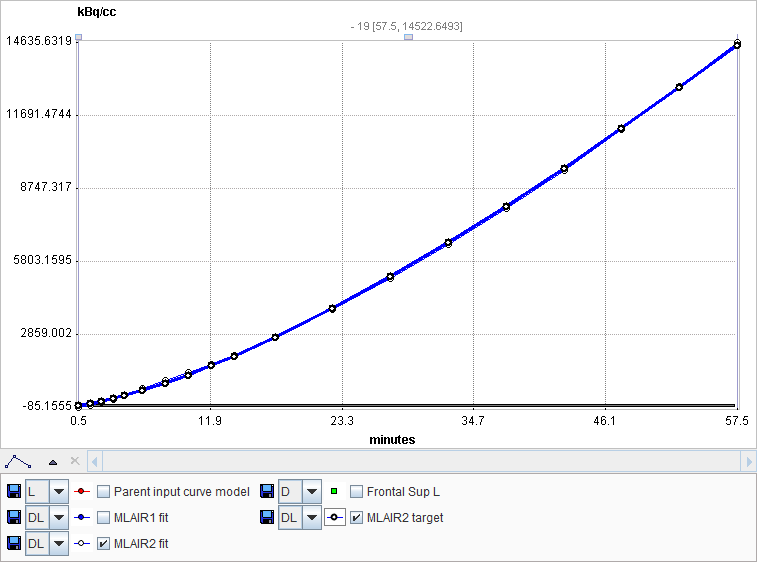
As soon as the Irreversible Ki (MLAIR) model is selected it fits the MLAIR1 and MLAIR2 model curves to the data using singular value decomposition and shows the regression coefficients. The parameter of interest is Ki which is calculated with both methods: Ki(MLAIR1) and Ki(MLAIR2).
The curve area initially shows the tissue TAC together with the MLAIR1 fit, whereas the MLAIR2-related curves are hidden because the have a completely different dynamic range. However, they can easily be shown by enabling the respective check boxes in the curve control area, as illustrated above.
Reference:
1.Kim SJ, Lee JS, Kim YK, Frost J, Wand G, McCaul ME, Lee DS: Multiple linear analysis methods for the quantification of irreversibly binding radiotracers. J Cereb Blood Flow Metab 2008, 28(12):1965-1977. DOI