In 2009 Zhou et al. introduced a new graphical method, the Relative-Equilibrium (RE) plot [1]. It can be applied with a plasma input curve for the calculation of the distribution volume, and with a reference tissue curve for the calculation of the binding potential. It was shown with Raclopride data and with simulations, that unlike the Logan plot the RE plot is not suffering from bias due to high noise levels. As a consequence, the results obtained with VOI-averaged TACs is consistent to the results obtained in pixel-wise applications.
However, it was found that violation of the relative equilibrium condition did introduce bias. To compensate this bias Zhou et al [2] combined the RE plot with the Patlak plot in a bi-graphical manner called the RE-GP Analysis.
Operational Model Curve
The operational equation of the RE Plot is given by:
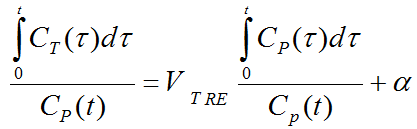
For the RE plot to be applicable there must exist a time t* after which two conditions are fulfilled:
1.The plasma input curve must be mono-exponential. This condition can be verified by fitting a single exponential to the late part of the plasma curve on the Blood tab of PKIN.
2.The ratio of CT/Cp is constant. This condition can be verified by switching the KM model to the Tissue/Plasma Ratio model.
Under these conditions the tracer in all tissue compartments reaches equilibrium relative to plasma. Note that the conditions must be verified explicitly, because the linear appearance of the RE plot is not a sufficient criterion.
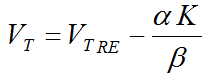
Violation of the relative equilibrium condition above introduces bias. To compensate this bias the RE plot was combined with the Patlak plot
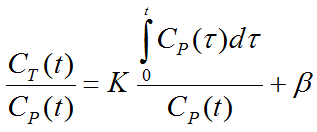
using the same t* for fitting two respective regression lines. A consistent and unbiased distribution volume is then obtained by combining the slopes and intercepts of the two plots:
For the pixel-wise application of the RE-GP Analysis the results of the Patlak plot are smoothed, so that the calculation turns into
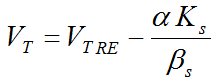
where Ks and βs are obtained from spatially smoothed maps of K and β.
Parameter Fitting
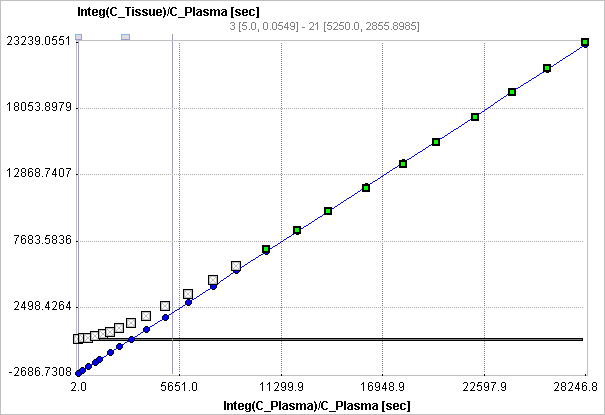
The RE-GP Analysis model calculates and displays the measurements transformed as described by the RE plot formula above. It allows fitting a regression line using the data points after a time t*. Note that t* must be specified in real acquisition time, although the x-axis units are in "normalized time". The corresponding normalized time which can be looked up in the plot is shown as a non-fitable result parameter Start.
If t* is changed to define a new data segment, the program finds the closest acquisition start time, fits the two regression lines to the RE plot and the Patlak plot, and updates the calculated parameters. The main outcome is the distribution volumes calculated with the RE-GP analysis (Vt-REGP). For a comparison, Vt calculated with the RE plot alone (Vt-RE) is also shown.
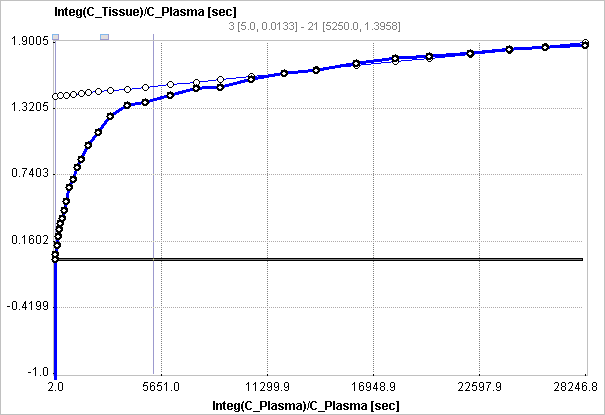
Per default, only the curves of the RE plot and its regression line are shown in the curve area. However, the Patlak plot and its regression line can also be visualized by enabling their boxes in the curve control area. Note that the values of the Patlak plot may have a very different dynamic range than the RE plot. Therefore it is recommended switching off the RE curves when switching on the Patlak ones.
References
1.Zhou Y, Ye W, Brasic JR, Crabb AH, Hilton J, Wong DF: A consistent and efficient graphical analysis method to improve the quantification of reversible tracer binding in radioligand receptor dynamic PET studies. Neuroimage 2009, 44(3):661-670. DOI
2.Zhou Y, Ye W, Brasic JR, Wong DF: Multi-graphical analysis of dynamic PET. Neuroimage 2010, 49(4):2947-2957. DOI